
|
|
It's useful to yourself and others to visualise a web site rating. The visualisations shown here, mostly represent an opinion of the site, seen through the eyes of a persona. The graphics can:
Last edited 2005-10-18
I like to go beyond the written description of what my visitor wants. I like to extend that persona with simple graphs. These make it easier to visualise, compare and understand.
Here's one way to do that:
These graphs were created to explore the impact of changes on the rating. That rating is mostly the opinion of Stuart, whose persona is described elsewhere on this site. He has a pragmatic, but exacting way, of judging web sites that takes many factors into consideration.
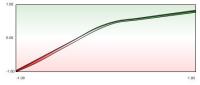
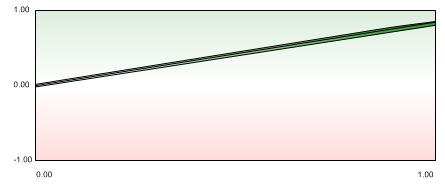
Although he considers a wide range of factors when judging a web page, content is particularly important. This graph shows that. It illustrates a page that is rated well on most counts. Even in that situation content is still dominant, it is able to move his opinion from very high to complete rejection. None of the other factors has quite that power.
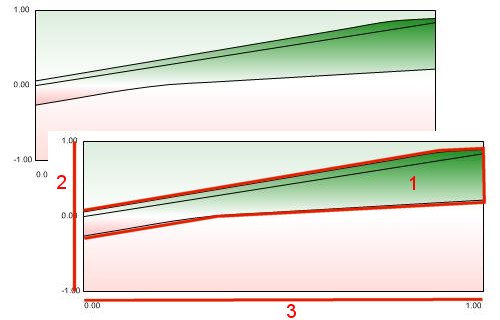
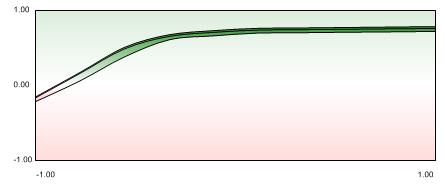
Some web teams give most time and effort to the visual design. If Stuart is their target they are likely investing too much. For him good looks won't raise his opinion much, though poor appearance will definitely lower it, even in the face of good content. Looking at the graph brings this home. (The underlying model includes several other appearance related factors which together can have a greater impact.)
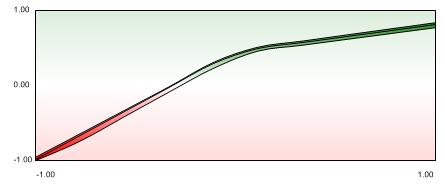
Findability is about finding a web site with a search engine. It is the life blood of most web sites. Without it no visitors. Findability is applied to Stuart's opinion, it is not part of that opinion. It allows a good page to achieve it's potential but does not raise that potential.
(Findability is indirectly linked to page quality. A good page will, in time, get links and thus gather strength on the search listings. With a new site that needs patience.)
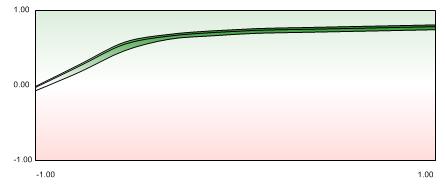
The opinion model contains other inputs, some entered by a panel of judges others by the technical team. Their impacts vary. Some are like hygiene factors, they decrease ratings when they are bad but don't raise them much when good.
One such is shown here. Font size adaptability. Stuart often wants to change font size, particularly when printing a page (to get more on the paper). It's a negative if he can't do this. (For other audiences it might be more important. If they have poor eyesight for example. If that's the case write the details into your persona.)
Putting these factors (and more) together is something that a good web site designer does all the time. Describing this to others can be hard though. Hopefully these graphs can make that easier. They and the underlying model can be used to: